Visualizing Data with Microsoft Visio 2021 Professional: Key Benefits for Businesses

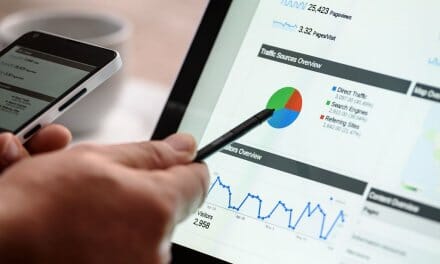
Data visualization is the representation of information through various graphs, charts, or animations. In modern business, visualization plays a vital role, allowing for quick analysis and interpretation of large volumes of data. In this article, we will examine the importance of applying data visualization and how Microsoft Visio 2021 Professional assists in this process.
Main Benefits and Applications of Data Visualization
One of the primary advantages of visualization is its ability to quickly comprehend large datasets. Graphical representation helps filter out unnecessary information and focus on the most important aspects. This is particularly relevant in the era of big data, where companies must process trillions of data points. According to a study by the International Institute for Analytics, companies using data visualization are 28% more likely to achieve their business goals than those who do not.
Visualization also paves the way for new insights and ideas. By studying data in a visual format, analysts can:
- Discover hidden patterns and relationships. For example, visualizing sales by region can reveal unexpected trends and correlations, such as the impact of weather conditions on the demand for certain products.
- Generate ideas for problem-solving. Presenting data as a mind map or Ishikawa diagram stimulates creative thinking and helps identify the root causes of problems. According to a Harvard Business Review survey, 74% of companies reported that visualization improves their ability to find insights in data.
- Explain complex data information easily. Infographics and dashboards allow even unprepared audiences to quickly understand key indicators and trends. A study from the Massachusetts Institute of Technology showed that students remember information from lectures accompanied by visual content 323% better.
Another important advantage of visualization is that it accelerates decision-making. By presenting data in an understandable graphical form, analysts help leaders quickly grasp the situation and take the necessary actions.
Data visualization is useful in various fields. For example:
- Medical researchers use it to identify risk factors for various diseases. The visualization of patient health data helped discover the link between obesity and type 2 diabetes. This allows doctors to prevent diabetes development in overweight patients proactively.
- Film critics use it to analyze how movies comply with the Bechdel test (the presence of at least two female characters who talk to each other about something apart from men).
- Manufacturing companies track the flow of goods and compare inventory levels with sales volumes. Diagrams linked to images of warehouse shelves and store displays allow real-time monitoring of product availability.
- Logistics firms use visualization to optimize delivery routes. Interactive maps with data on traffic, travel time, and fuel consumption help find the most efficient paths.
- HR specialists apply visualization to analyze employee engagement and productivity. Dashboards with performance indicators, staff turnover, and absenteeism provide a holistic picture of personnel status.
Microsoft Visio 2021: Professional Capabilities for Data Visualization
Microsoft Visio 2021 Professional offers a wide range of tools for creating informative and attractive data visualizations. Visio supports various data sources, including Excel tables, SQL Server databases, Azure Active Directory, and many others. Data can be imported directly into Visio or linked to external sources for automatic updates. This ensures that visualizations are always based on the most up-to-date information.
The Visio library contains over 250,000 shapes and dozens of ready-made diagram templates. This allows for the quick creation of professional-looking visualizations without extra effort. Templates cover many common types of diagrams and schemas, such as:
- flowcharts and data flow diagrams;
- organizational and functional charts;
- floor plans and office layout schemas;
- network and IT diagrams;
- timelines and Gantt charts.
All templates are easily adaptable to specific needs using built-in formatting tools. Additionally, users can create their own shapes and templates for repeated use.
Another important advantage of Visio is its ability to collaborate in real time. Users can simultaneously edit diagrams, seeing each other’s changes. All files are saved in the cloud and accessible anytime from any device. This simplifies interaction for distributed teams and ensures complete data synchronization. Visio also supports flexible access settings, allowing restrictions on editing rights for individual users.

Visio integrates excellently with other Microsoft products. For example:
- The Visio Data Visualizer add-in allows the creation of diagrams directly in Excel. This is convenient for quickly visualizing tabular data without switching between applications. When data in Excel is updated, diagrams in Visio automatically change.
- Visio visualizations can be added to Power BI reports for more in-depth data analysis. Combining process diagrams and performance indicators provides a holistic view of the organization’s operations. Visualizations update at the same frequency as Power BI reports.
- Visio diagrams are easily embedded in Office documents and presentations. This allows supplementing text reports with visual graphics and schemas. Embedded diagrams are linked to the original Visio files and updated when changes are made.
- Collaborative work on visualizations is conveniently conducted in Microsoft Teams. All team members can view and comment on Visio diagrams when they are added as separate tabs. This simplifies the discussion and coordination of visual materials.
Microsoft Visio 2021 Professional is a powerful tool for data visualization, opening up broad opportunities for business analysis. A rich library of shapes, support for collaborative work, and integration with other Microsoft products make Visio an optimal choice for companies striving to make data-driven decisions.


